


California Electricity Imports
Buy High and Sell Low

California’s electricity imports are among the highest in the U.S., but the net figures—offset by solar exports—mask a costly problem. By examining hourly import/export swings alongside real-time electricity prices, it’s clear that these dynamics are inflating California’s already steep electric rates.
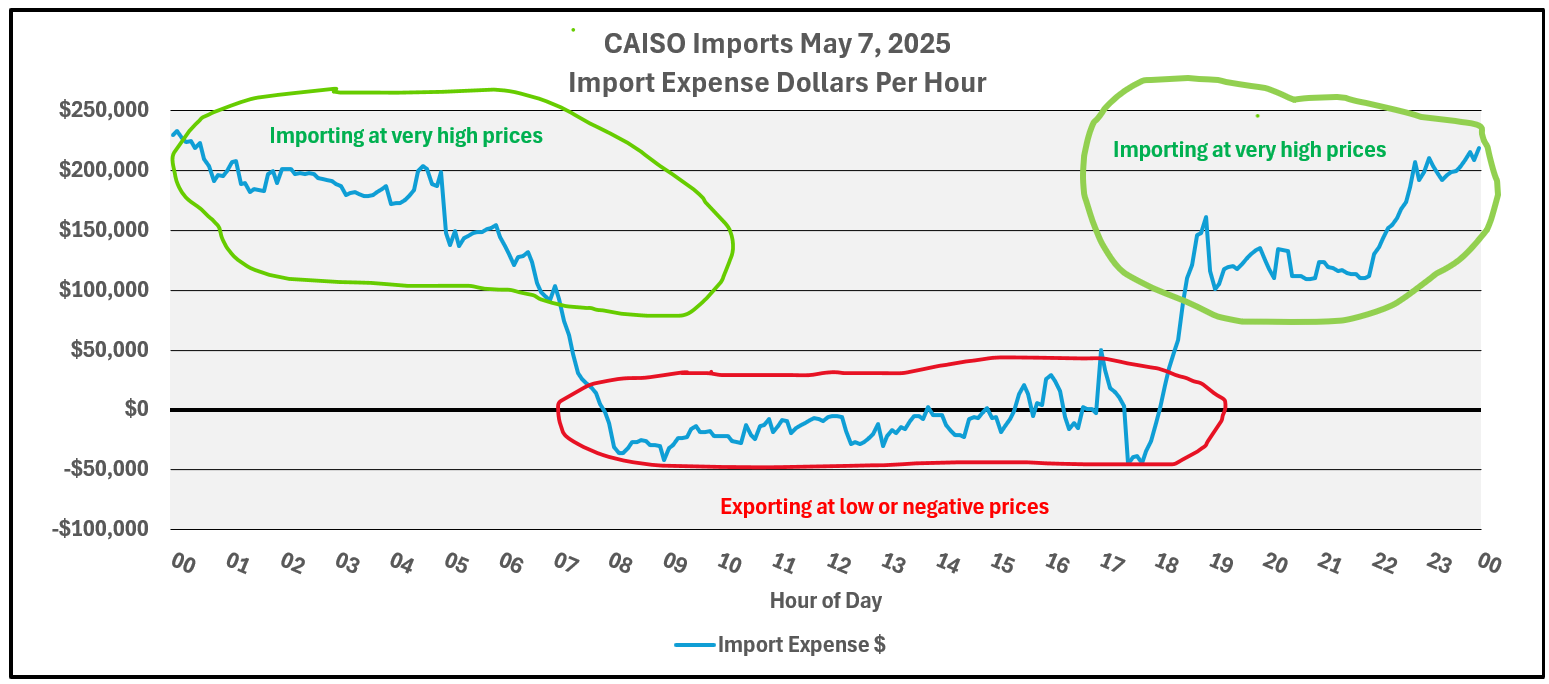
May 7, 2025 Electric Imports
The graph below illustrates California’s electricity flow on May 7, 2025. From midnight to 8 AM, the state imports power. Between 8 AM and 6 PM, solar production surges, flipping California into export mode. After 6 PM, imports resume as solar output fades.

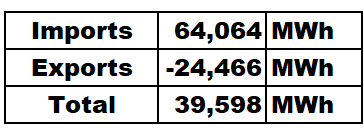
This table summarizes the day’s swings, with “net imports” reflecting imports minus exports:

These dramatic shifts from importing to exporting and back again drive inefficiencies that ripple through California’s electricity market.
Why Should the Imports Matter to You?
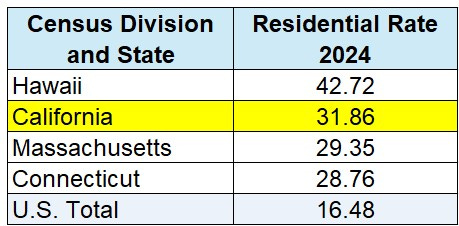
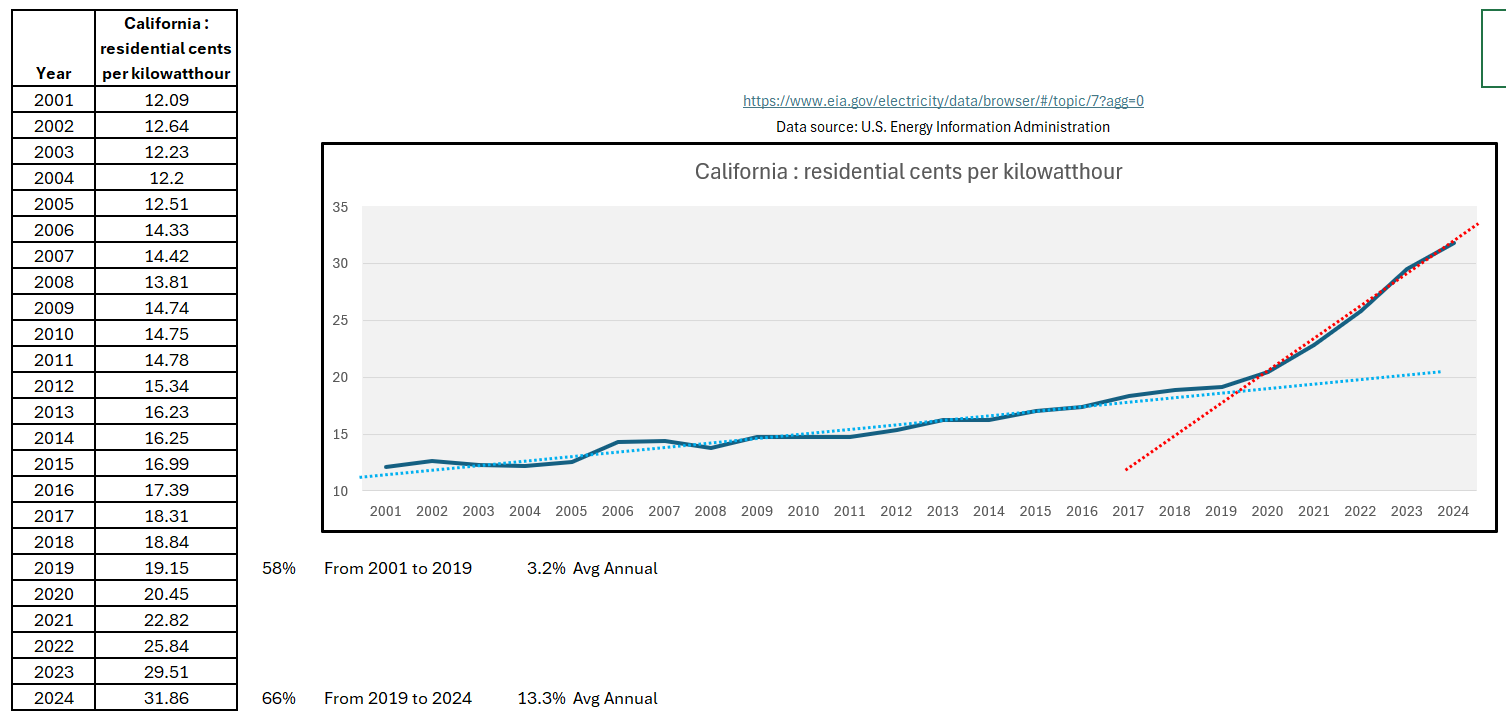
California’s residential electricity rates are the second highest in the U.S., trailing only Hawaii, and roughly double the national average. Recent rate hikes have been relentless:
From 2001 to 2019, rates rose at an average of 3.2% annually. Since 2019, however, the annual increase has skyrocketed to 13.3%. These soaring costs hit consumers hard, raising questions about the state’s energy policies.
Causes of the Import to Export Swings
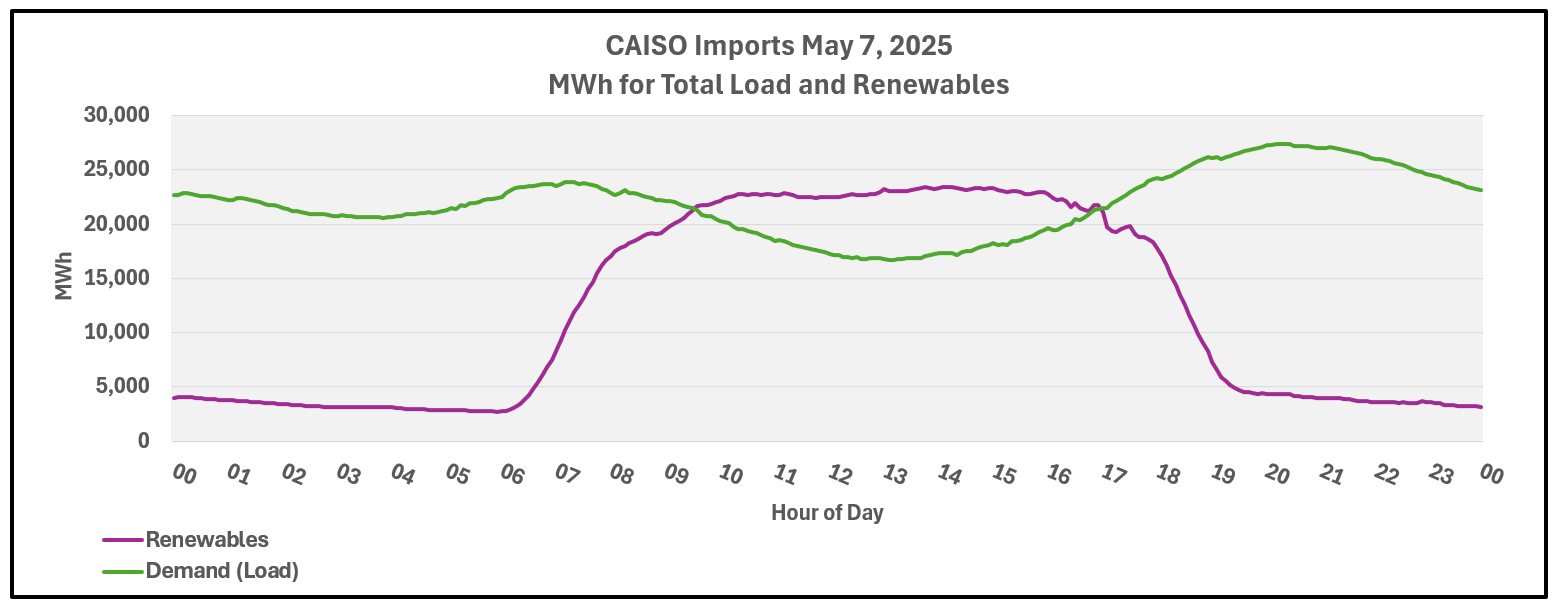
California’s reliance on solar power creates a predictable pattern. The graph below shows customer demand (green line) versus renewable generation (purple line). When solar output exceeds demand—typically from sunrise to sunset—California exports excess power.
Another key metric is the “net demand” or “duck curve,” which subtracts solar and wind generation from total demand. This curve, named for its duck-like shape, peaks in the evening when solar production drops and household usage spikes.
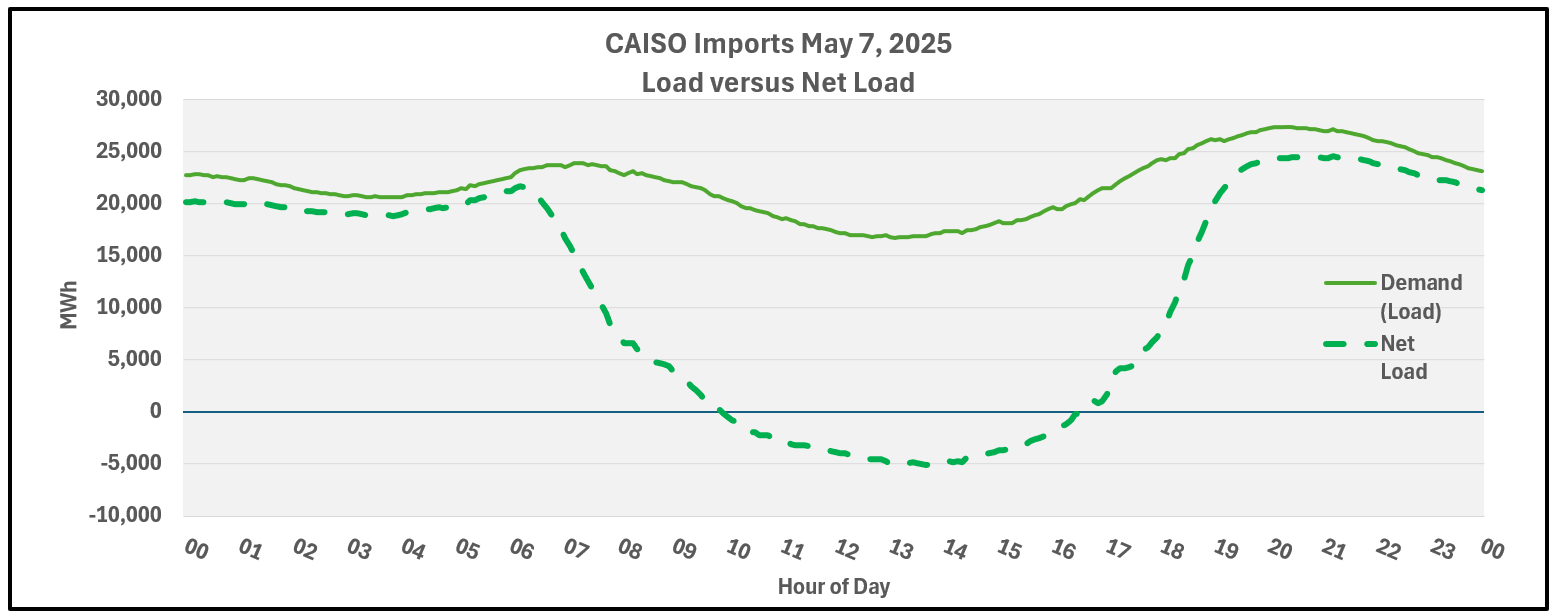
These patterns explain why California swings between importing and exporting power, often at inopportune times.
Real-Time Electricity Prices
Real-time pricing, specifically Locational Marginal Pricing (LMP), reflects market dynamics. On May 7, a representative LMP point in California started at ~$40 per MWh at midnight, dipped to negative values by 2 PM as solar flooded the grid, and climbed back to $30–$40 by 6 PM.
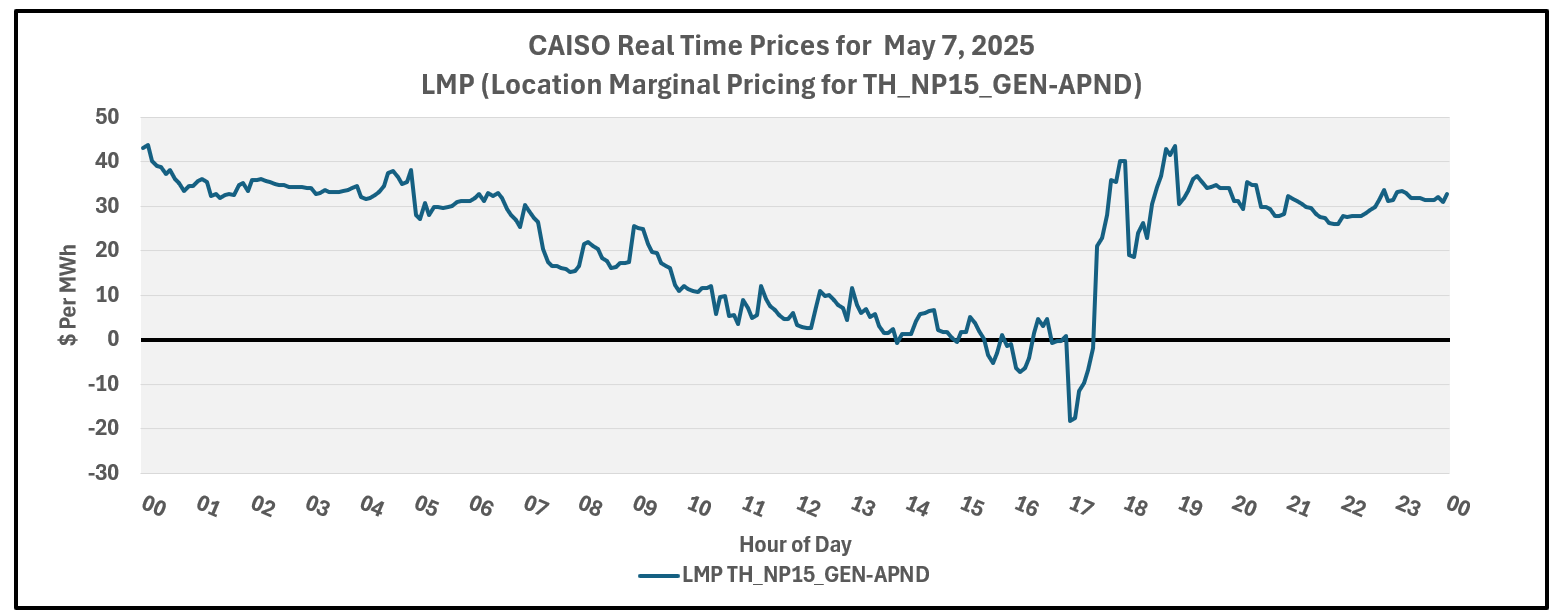
This pricing rollercoaster mirrors solar production. When California exports excess solar power, prices plummet—sometimes below zero—meaning producers pay to offload electricity. Consumers, however, don’t see these savings. Instead, they face high rates tied to costly imports during peak hours.
Neighboring States Cash In
As I noted in a previous post, Melody Petersen’s investigative reporting for the Los Angeles Times revealed how Arizona benefits from California’s solar surplus. In 2024, Arizona’s largest utility saved $69 million by buying California’s excess solar power at rock-bottom prices, passing those savings to its customers as bill credits.
Energy consultant Gary Ackerman explains that California’s oversupply drives prices so low they can turn negative. Solar farms, incentivized by renewable energy credits (RECs), keep producing even when it’s unprofitable. RECs allow utilities or companies to claim environmental benefits without reducing actual fossil fuel use—a practice critics call greenwashing. California ratepayers foot the bill for this market distortion.
Conclusion: A Costly Cycle - Buy High and Sell Low
On May 7, 2025, California imported 64,000 MWh at high prices and exported 24,500 MWh at low or negative prices. Neighboring states and solar producers profit, but California consumers are left with soaring bills. The state’s aggressive solar expansion, without adequate storage, exacerbates this “buy high, sell low” cycle.
California must pause new solar projects until it can store excess power effectively. The state has invested heavily in batteries, but current capacity falls short. Without a course correction, ratepayers will continue to bear the cost of this mismanaged energy strategy. It’s time to stop the madness.