


Sun, Wind and Fire
2024 U.S. Energy Consumption Report


Introduction
How did the United States power itself in 2024? This report, based on the EIA’s Monthly Energy Review (tables 1.3 and 10.1, released May 27, 2025), explores this finding in the context of broader energy trends. By comparing fossil fuels, nuclear, and renewables, analyzing changes over the past four years, and examining EIA reporting practices, this report seeks to inform balanced energy policies and challenge assumptions about the energy transition. While wind and solar energy dominate headlines, the EIA’s latest data reveals the obvious: biofuels and wood energy contributes more to renewable energy consumption than wind or solar, even after large investments.
U.S. Energy Consumption Overview
In 2024, the U.S. energy mix remains dominated by fossil fuels, followed by nuclear and renewable sources. According to EIA Table 1.3, fossil fuels (petroleum, natural gas, and coal) account for approximately 82% of total energy consumption, measured in Quadrillion British thermal units (quads). Nuclear energy contributes 9%, while renewables, including hydro, wood, biofuels, wind, solar, and geothermal, make up 9%.
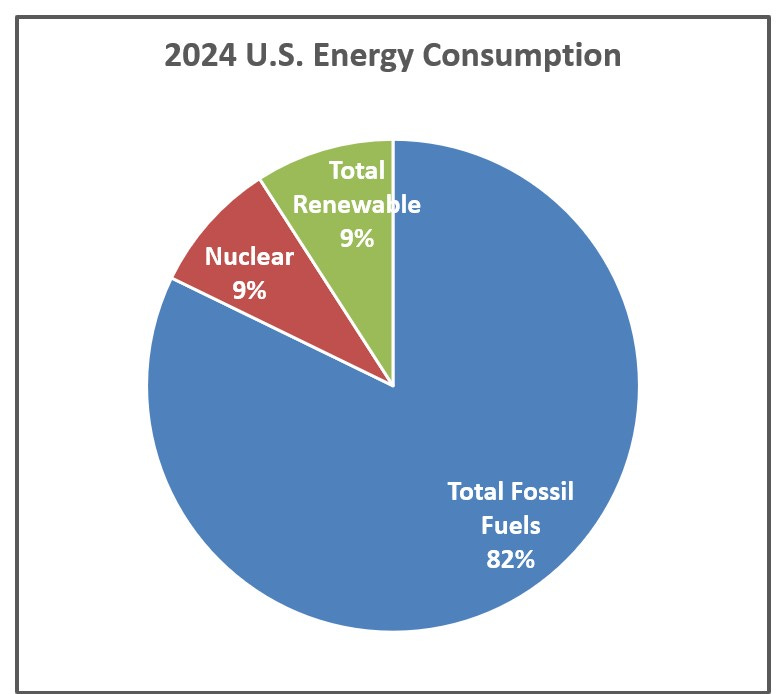
Figure 1: U.S. Energy Consumption by Source, 2024 (Source: EIA Table 1.3). This chart illustrates the dominance of fossil fuels, with renewables forming a smaller but growing share.
Renewable Energy Breakdown
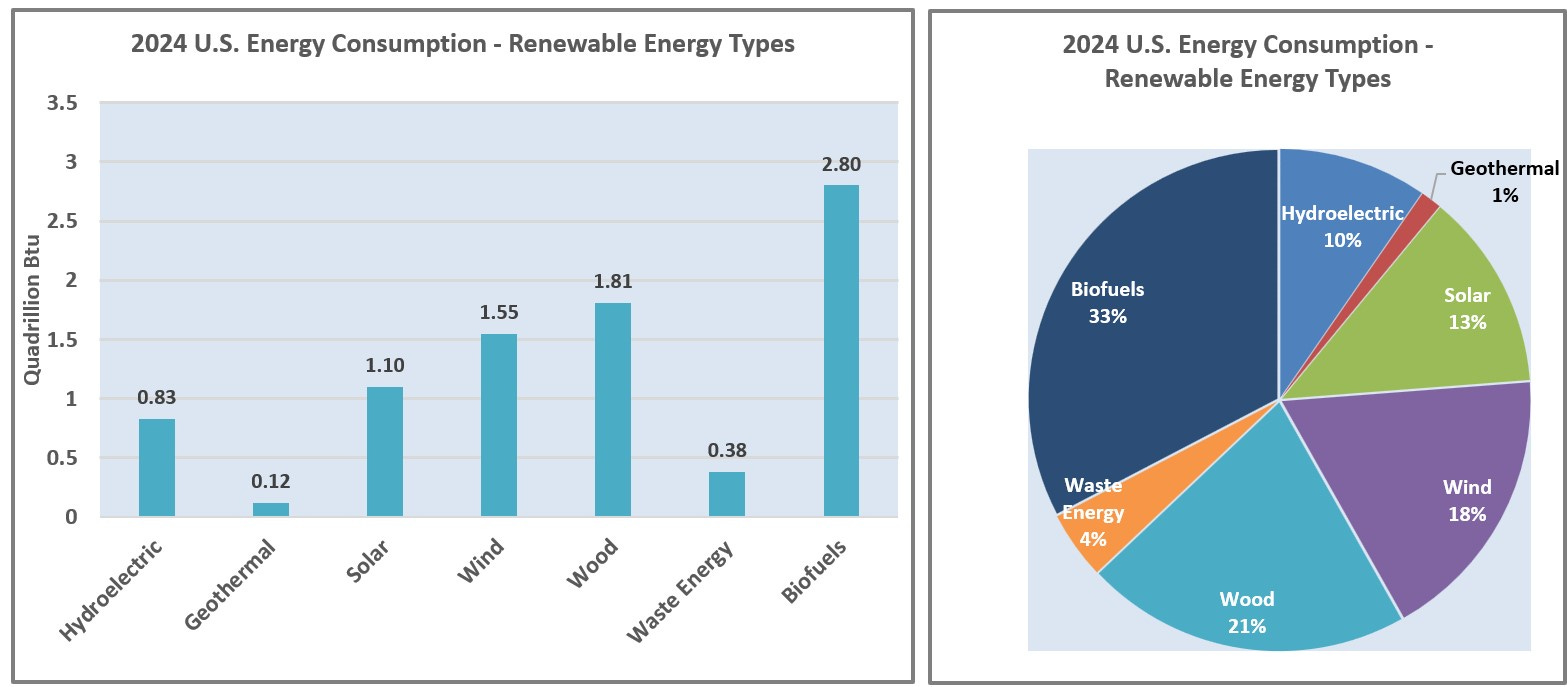
Figure 2: Renewable Energy Consumption by Type, 2024 (Source: EIA Table 10.1). This chart highlights biofuel and wood’s leading role among renewables, followed by with wind and solar.
Among renewables, biofuels and wood energy stands out as the significant contributors, outpacing wind and solar. EIA Table 10.1 (converted from Trillion Btu to Quadrillion Btu by dividing by 1,000) shows biofuel energy consumption at 2.8 quads, wood energy consumption at 1.81 quads, compared to 1.55 quads for wind and 1.1 quads for solar in 2024. Hydroelectric energy consumption is 0.83 quads and geothermal is 0.12 quads. When we look at primitive energy types, we get more energy from wood than we do from wind or solar.
Energy Consumption Trends Over Four Years
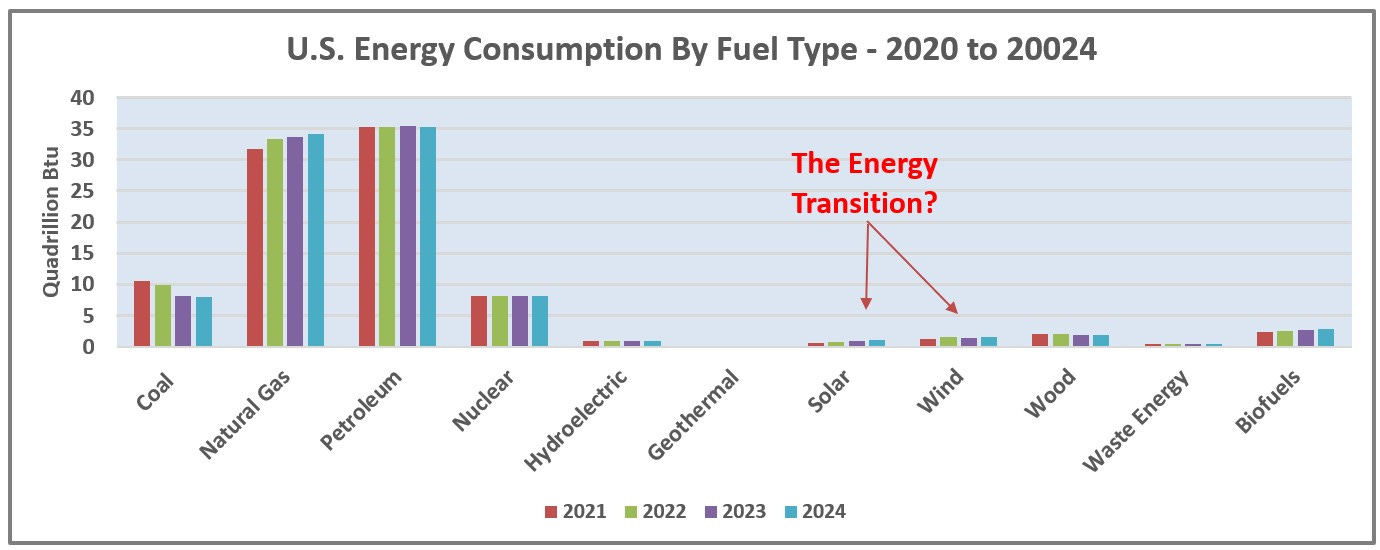
Figure 3: U.S. Energy Consumption Trends, 2021–2024 (Source: EIA Table 1.3). This chart illustrates the decline in coal, rise in natural gas, and modest growth in renewables.
Energy consumption patterns from 2021 to 2024 reveal a gradual shift in the U.S. energy mix. Coal consumption has declined by approximately 2.65 quads, largely offset by a rise in natural gas use of 2.49 quads. Renewable energy sources have grown modestly, with wind and solar showing increases of 0.26 quads and 0.47 quads, respectively, but their overall share remains small compared to biofuels and wood.
Despite significant investments in wind and solar, their contributions remain limited, underscoring the slow pace of the energy transition.
EIA Reporting Practices
The EIA’s presentation of renewable energy data can shape perceptions of the energy landscape. In its reports, the EIA often aggregates all renewables (hydro, wood, biofuels, wind, solar, and geothermal) into a single category, which amplifies their apparent contribution. For example, Figure 4 shows renewables as a unified group, contributing 9% to the total energy consumption.
Figure 4: EIA’s Aggregated Renewable Energy Consumption, 2024 (Source: EIA Table 1.3). This chart combines all renewables to highlight their collective impact.
When disaggregated, however, individual renewable sources like wind and solar appear minimal, as shown in Figure 5. This disaggregated view reveals that wind contributed 1.6% to the total and solar contributed 1.2%.
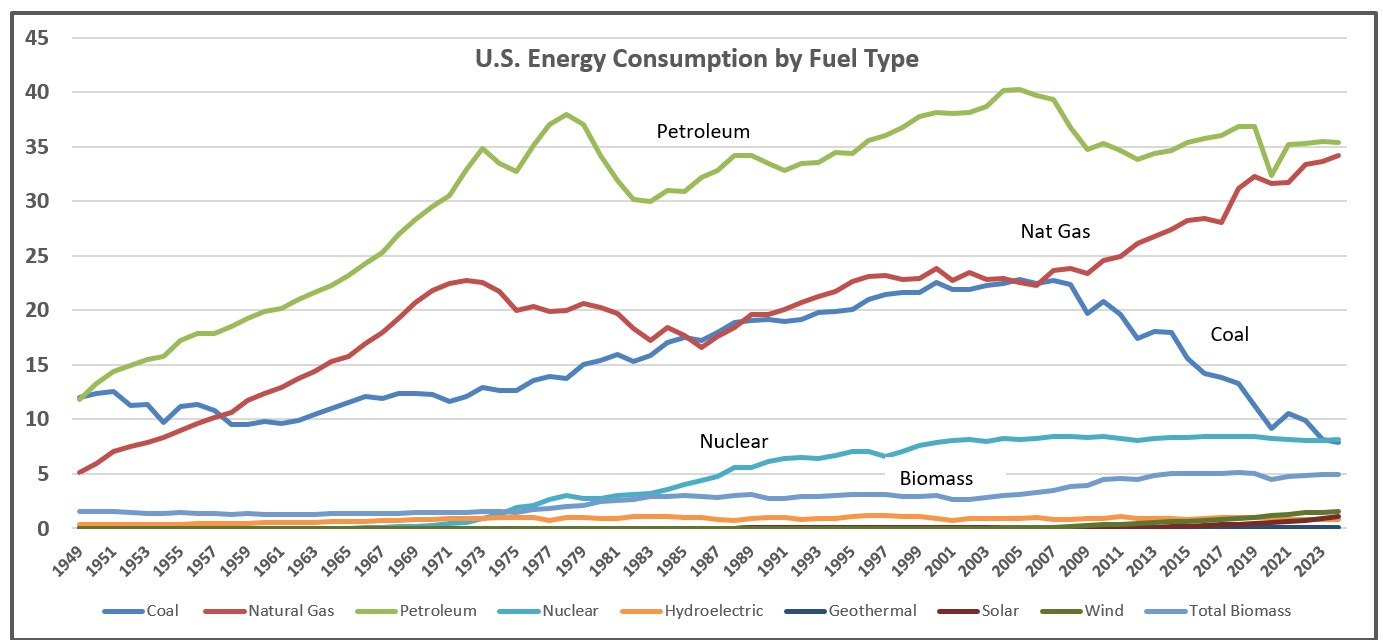
Figure 5: Disaggregated Renewable Energy Consumption, 2024 (Source: EIA Table 10.1). This chart shows the individual contributions of renewable sources, with wind and solar near the baseline.
This reporting practice highlights the importance of scale in understanding energy data. Aggregating renewables can create an impression of significant progress, while disaggregated data underscores the challenges of scaling newer technologies like wind and solar.
Data and Methodology
All data is sourced from the EIA’s Monthly Energy Review (May 27, 2025), specifically tables 1.3 and 10.1. Table 1.3 reports energy consumption in Quadrillion Btu (quads), a standard unit for large-scale energy measurement. Table 10.1 uses Trillion Btu for smaller renewable sources, requiring conversion to quads (dividing by 1,000) for consistency. This conversion ensures accurate comparisons across energy types.
Conclusion
The 2024 EIA data reveals that fossil fuels remains the cornerstone of U.S. energy consumption representing 82% of the total. Nuclear has remained steady with 9 % of the total energy consumption and is beginning develop the potential future developments.
For renewables, biofuels and wood energy remain the leaders over wind and solar despite their prominence in public discourse. The EIA’s aggregation of renewables can obscure the significant contributions of biofuels and wood, highlighting the need for transparent data presentation.
I'm not sure if you (or EIA) got this right. We must differentiate heat (thermal) energy from electric (work) energy. EIA's "primary" and "secondary" energy descriptions are not so clear. It typically takes 3 kWh (heat) to make 1 kWh (work). Solar and wind generate electric energy (work). Perhaps the other sources are all heat energy. You need to make them comparable.