


2024 Electricity Generation
Part 3 - States With Highest Electric Costs

In Part 2, I examined Utah, the state with the lowest electricity costs in 2024. Now, I turn to the states with the highest costs to identify trends and potential drivers behind these elevated rates.
Determine Highest Cost States
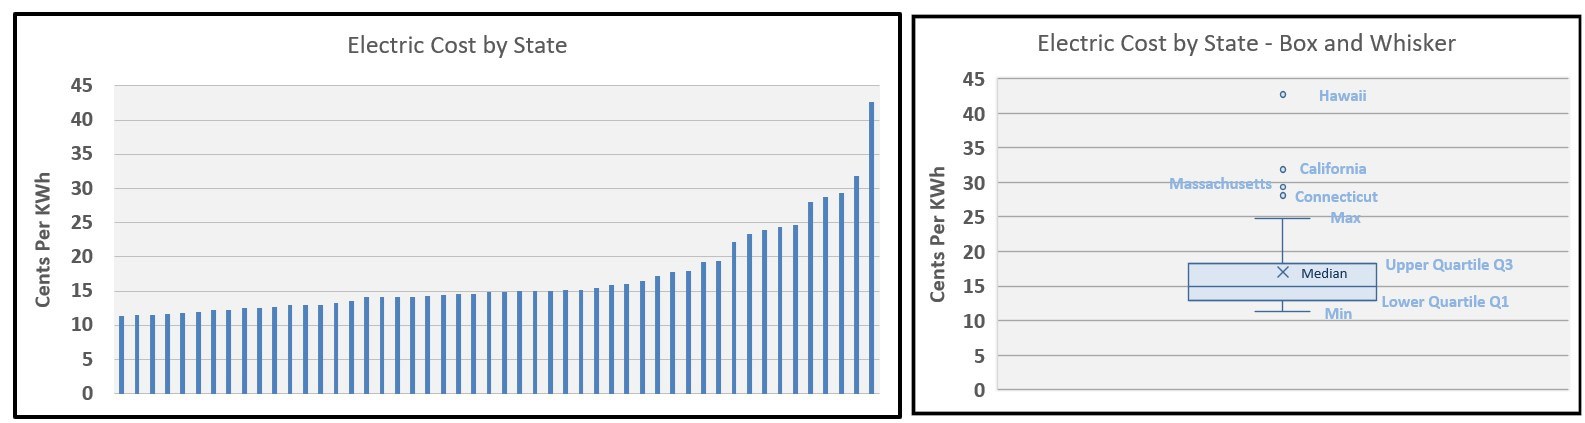
A Box and Whisker Plot (also called a box plot) is a way to visually show how a set of numbers is spread out. It helps identify patterns, such as whether most values are close together or if there are extreme outliers. There is plenty of information online for those interested in more details, but my key point here is that my selection of four states was based on statistical analysis rather than arbitrary choice.
This analysis identified four states where electricity prices were outliers—significantly higher than the statistical norm. The four highest-cost states and their electricity costs in cents per kWh in 2024 were:
Hawaii - 42.72
California - 31.86
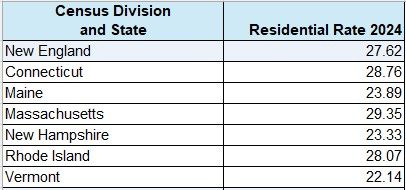
Massachusetts - 29.35
Connecticut - 28.76
Hawaii: A Unique Case
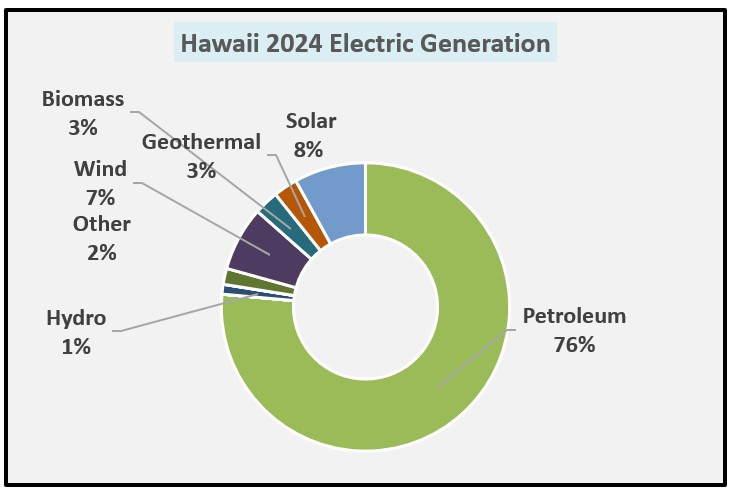
Hawaii’s electricity mix in 2024 consisted primarily of:
76% Petroleum
8% Solar
7% Wind
Hawaii’s high electricity prices are largely due to its dependence on petroleum-fired power plants. The state lacks local natural resources and faces high shipping costs. Additionally, Hawaii operates multiple independent grids that are not interconnected, preventing electricity load balancing across islands.
Hawaii’s high electricity costs are somewhat offset by its relatively low electricity consumption due to its mild climate. However, the state’s push for 100% renewables by 2045 (Act 15) appears to be struggling, even with high electricity rates and federal incentives from the Inflation Reduction Act (IRA).
For comparison, my home state of Oklahoma charges just 12 cents per kWh and has a greater share of renewable generation than Hawaii. If wind and solar were truly the best solutions, Hawaii—where electricity costs 43 cents/kWh and the federal government subsidizes one-third of capital costs—should be a model of success. If it doesn’t work here, then it shouldn’t work anywhere.
California: A Case of Expensive Energy Choices
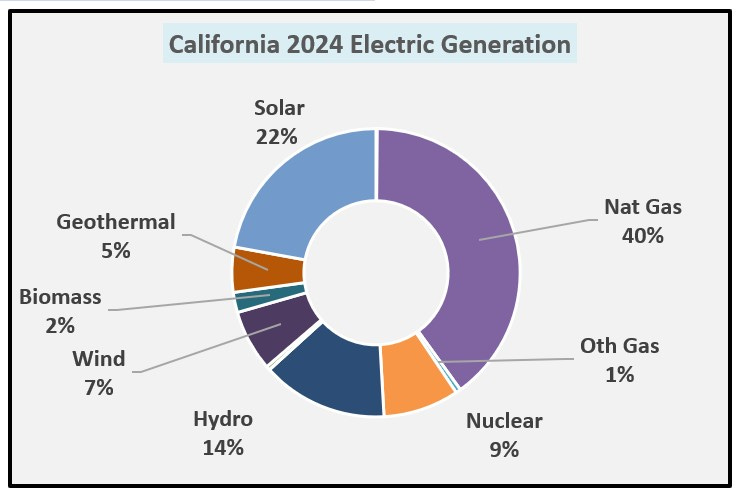
California has a diverse electricity mix, but does that alone explain its high rates?
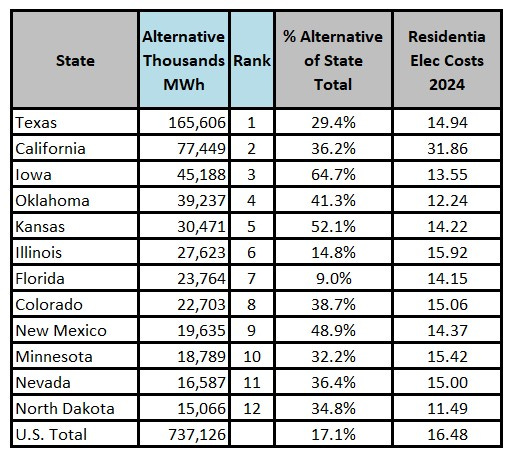
Comparing California to Other States with Alternative Energy
Texas generates about twice as much electricity as California but has below-average prices.
Iowa generates 64.7% of its electricity from alternatives and also has below-average prices.
Every state with high alternative generation (Renewable Less Hydro) except California has lower-than-average electricity prices. The table below shows the ranking for alternative energy generation for the top 12 states. Note that every state on this list except California is below the U.S. average.
California’s energy supply data from March 14th shows a heavy dependence on natural gas and imports due to solar’s limited availability throughout the day.
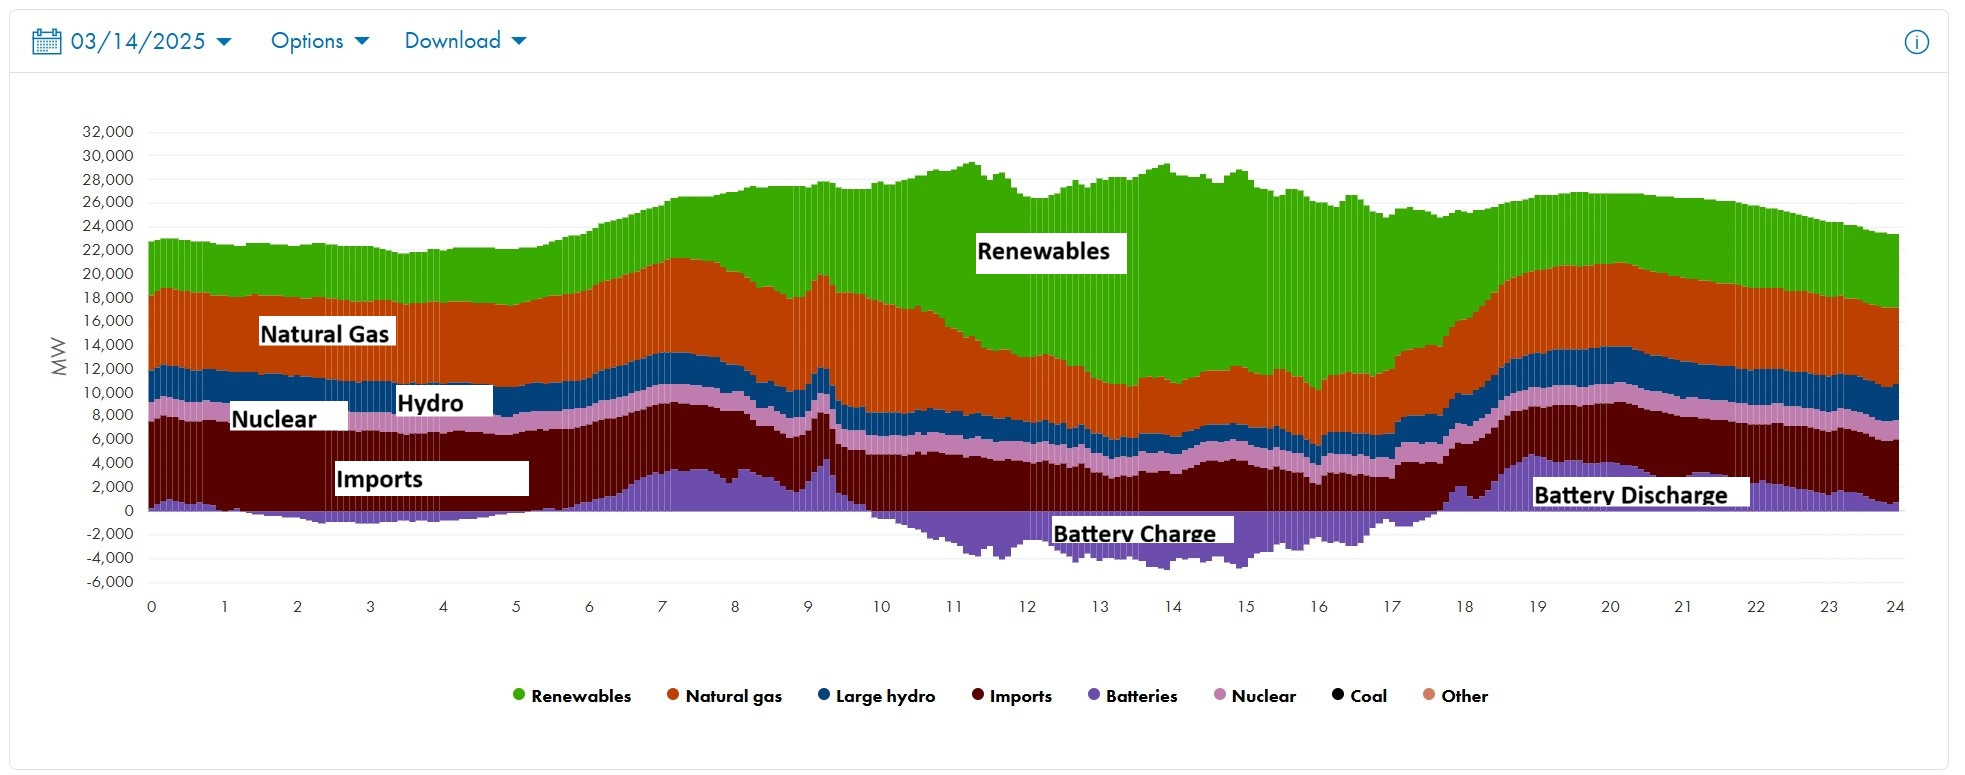
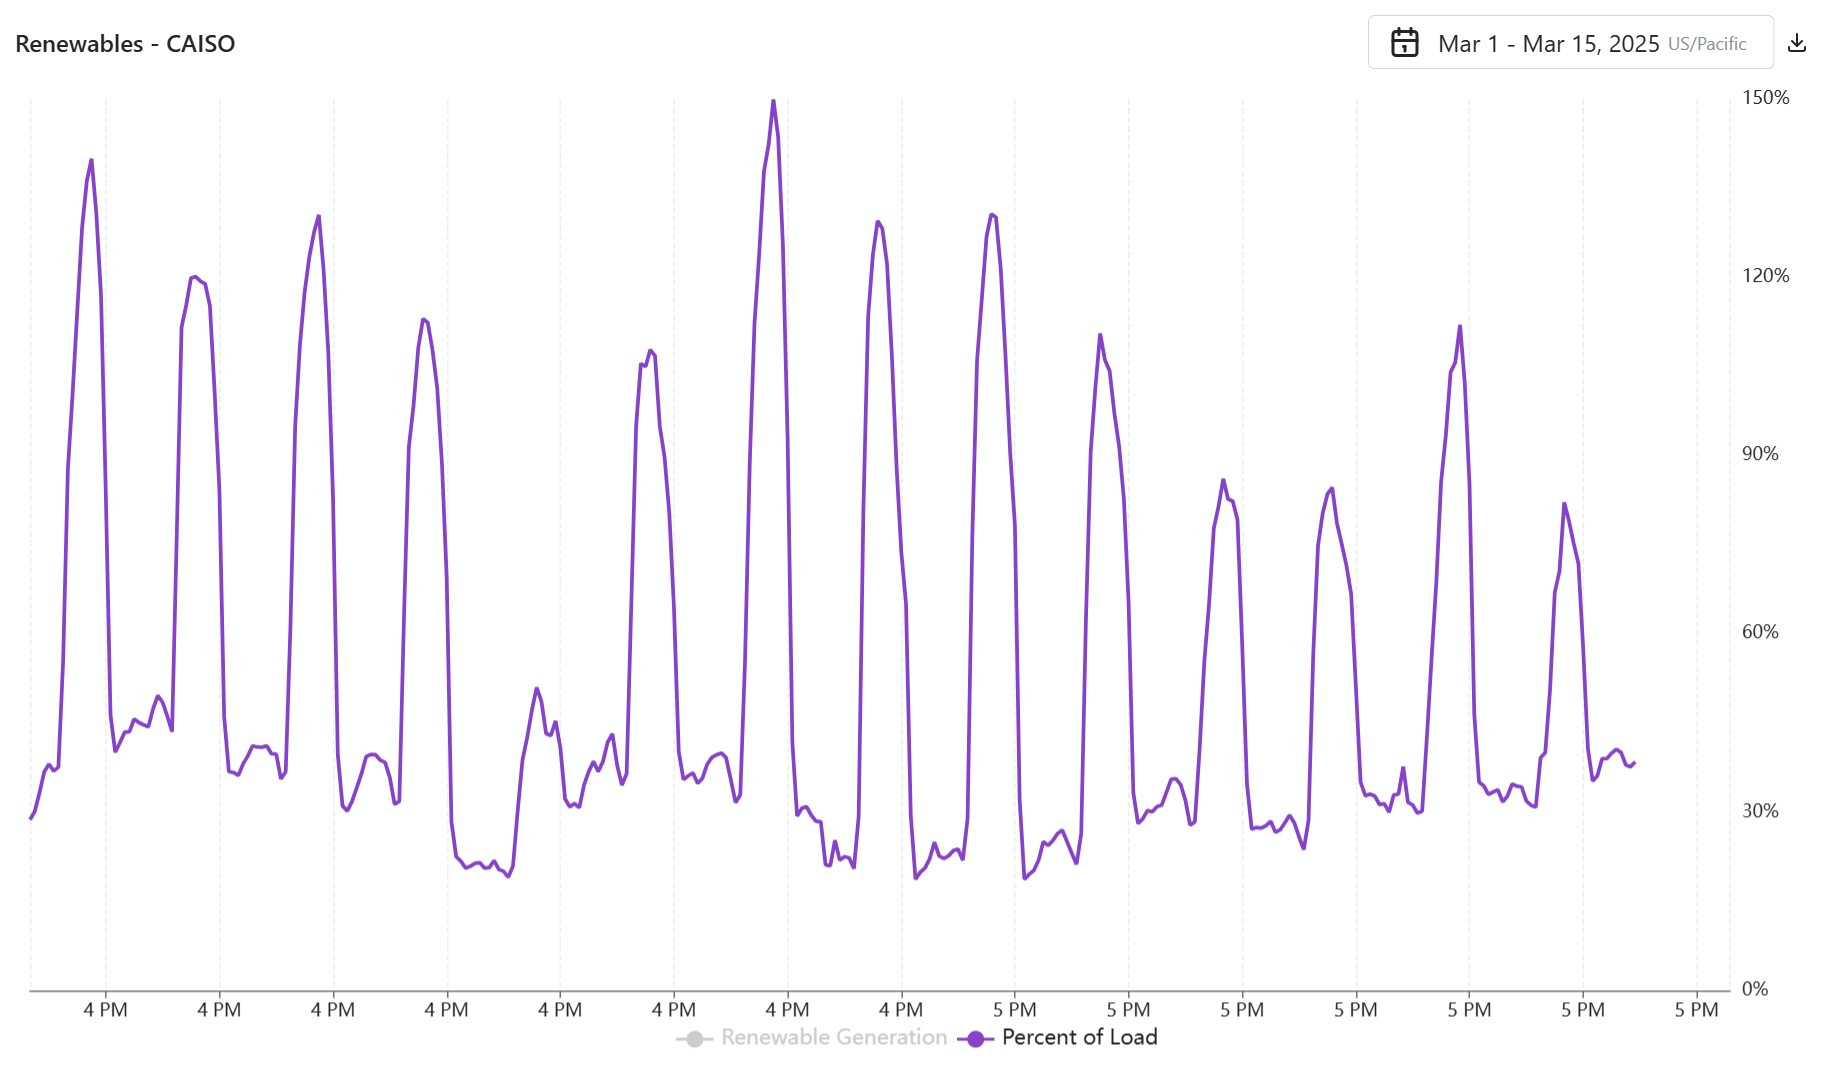
Looking at CAISO data, renewables can swing from 150% of load to just 30% within a single day. Managing these fluctuations adds costs, particularly for backup generation, storage and imports.
What makes California different?
Heavy Investment in Battery Storage
California has nearly half of all battery storage in the U.S., an expensive investment that contributes to high electricity costs. Battery storage requires substantial upfront capital, has a limited lifespan, and suffers efficiency losses when storing and discharging energy.
High Dependence on Imports
California imports a large portion of its electricity, particularly outside daylight hours when solar production drops. Some of these imports come from Utah, Arizona, and other states with much lower electricity costs. The revenue Utah earns from California’s electricity purchases may help explain why Utah enjoys the lowest prices in the nation.
Net Energy Metering (NEM) Policy
California’s NEM policies disproportionately benefit wealthy homeowners with solar panels, shifting costs onto the average consumer. Solar homeowners are reimbursed for electricity produced during peak solar hours when supply often exceeds demand. At times, California even pays Arizona to take excess electricity, while still compensating homeowners for generation. This results in non-solar customers subsidizing these inefficiencies.
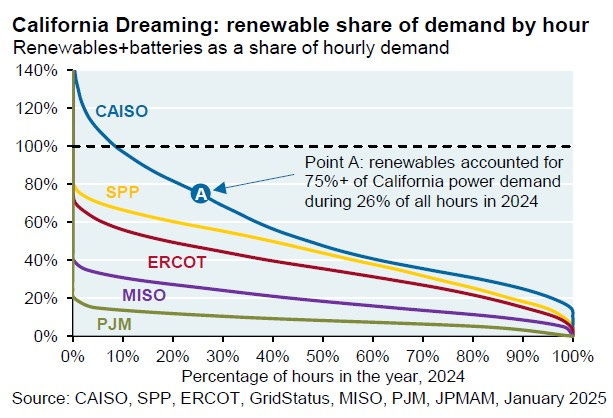
For California, I leave you with a final thought that sums up intermittent solar. “Point A shows that renewables plus storage met 75%+ of the load in California, but only in 26% of all hours in the year. So, while renewables do meet substantial shares of the load in California from time to time, in most hours of the year, California’s power demand is still highly reliant on fossil fuels, nuclear power and electricity imports. This is something that those LinkedIn posts usually fail to mention.”
Connecticut and Massachusetts: New England’s Expensive Energy Landscape
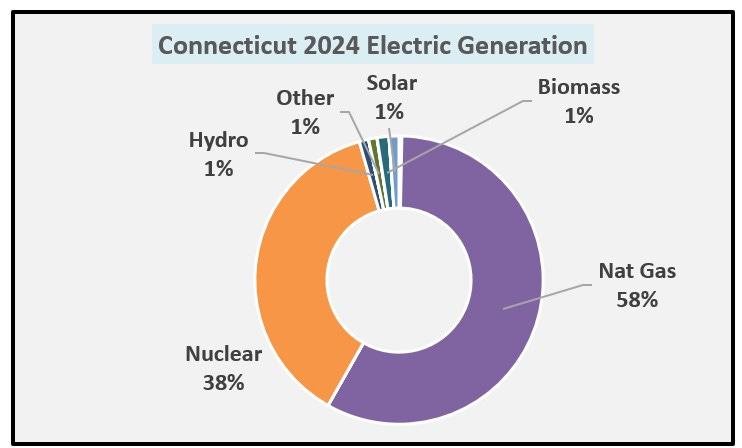
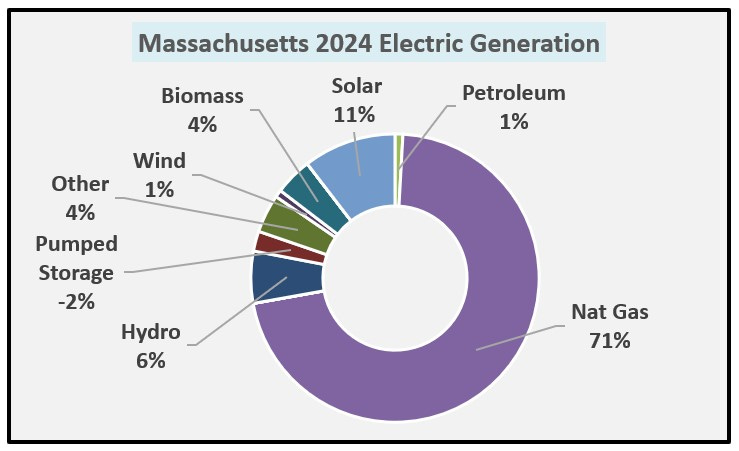
New England’s electricity costs are consistently among the highest in the U.S. Instead of analyzing Connecticut and Massachusetts separately, let’s examine the region as a whole:
53.8% of its electricity comes from natural gas
Regional average electricity cost: 27.62 c/kWh
The Root of the Problem: Pipeline Restrictions
The region has built its electricity grid around natural gas—but at the same time, it has blocked new pipeline construction. Despite being near the Marcellus Shale—one of the largest natural gas reserves—New York and New England block pipeline access, limiting their ability to benefit from lower prices.
As a result:
✅ Natural gas demand stays high
✅ Supply remains artificially constrained
✅ Expensive LNG (liquefied natural gas) imports become necessary
In some cases, New England has even resorted to burning petroleum—a fuel that even Hawaii is trying to move away from.
These policy choices contribute significantly to high electricity costs.
Conclusions
Hawaii’s high electricity costs stem from unique geographic challenges, but the other three outliers—California, Connecticut, and Massachusetts—face high costs due to policy decisions.
Texas demonstrates that renewable energy can coexist with low electricity costs when market and regulatory conditions support affordability. In contrast:
California’s high reliance on solar causing the daily extreme cycling of makeup by conventional sources and California’s high battery storage investments, reliance on imports, and NEM policies increase costs.
New England’s pipeline restrictions artificially constrain supply, forcing reliance on expensive imported LNG.
Ultimately, electricity costs are not determined solely by energy sources but by policy decisions that shape market conditions.
Very informative, good points regarding California energy fallacies.
"renewables plus storage met 75%+ of the load in California, but only in 26% of all hours in the year. So, while renewables do meet substantial shares of the load in California from time to time, in most hours of the year, California’s power demand is still highly reliant on fossil fuels, nuclear power and electricity imports."
Very good, informative article. I believe the facts are starting to turn the ship around from pursuing these ridiculous energy mandates that obviously are not going to work. 100% RE is a fallacy and economic insanity.
I really appreciate the details, data and graphics. I eat that stuff up! Thanks